Copper Prices Fell! SUNSHINE Weekly Scrap Prices Tracker: July 7-11, 2025
This week (July 7 to July 11, 2025), scrap metal prices exhibited some fluctuations across different markets. Based on the price data from SUNSHINE for scrap metals in China, India, and United States, the following is a report on the prices of Copper Scrap and Aluminum Scrap in the three countries.
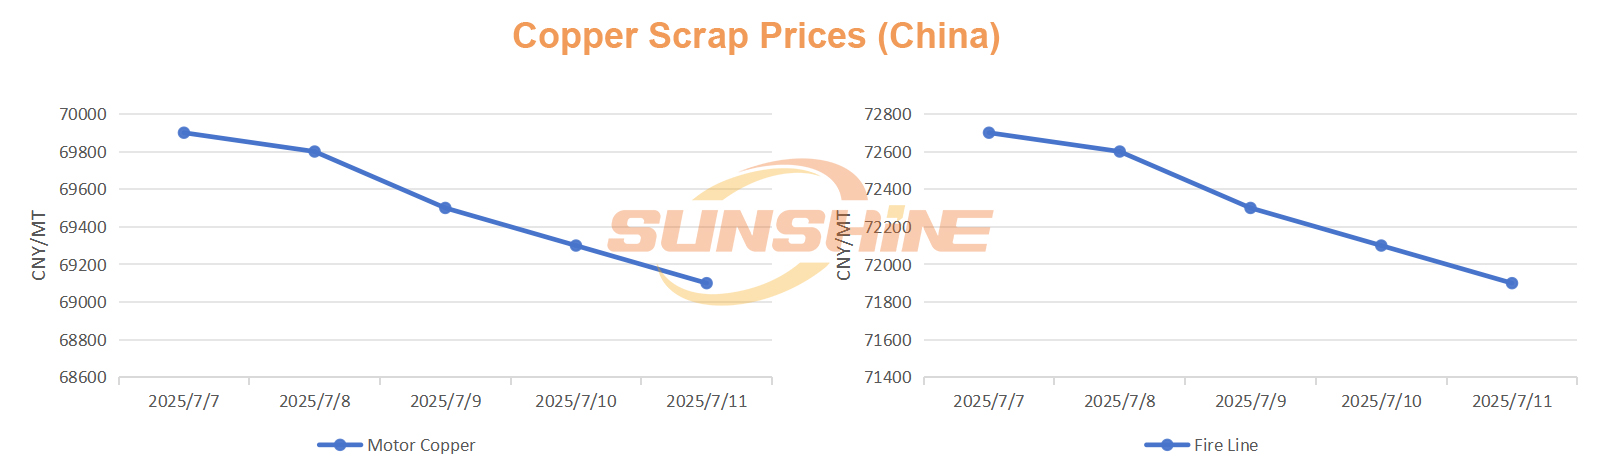
China – Scrap Copper Prices
During the week of July 7–11, 2025, scrap copper prices in China showed a consistent downward trend, with daily declines ranging from 0.1% to 0.55%. The overall weekly decrease ranged from 0.49% to 1.14%. Compared to the previous week (reference date: July 4), prices dropped by 0.87% to 1.43%.
Motor Copper saw the largest drop, falling from 69,900 CNY/MT (July 7) to 69,100 CNY/MT (July 11), a decrease of 800 CNY/MT or 1.14%.
Week-over-week, Motor Copper experienced the largest decline, followed by Fire Line, which dropped from 72,900 CNY/MT to 71,900 CNY/MT, down 1,000 CNY/MT or 1.37%.
The chart below shows the weekly price trends of Motor Copper and Fire Line.
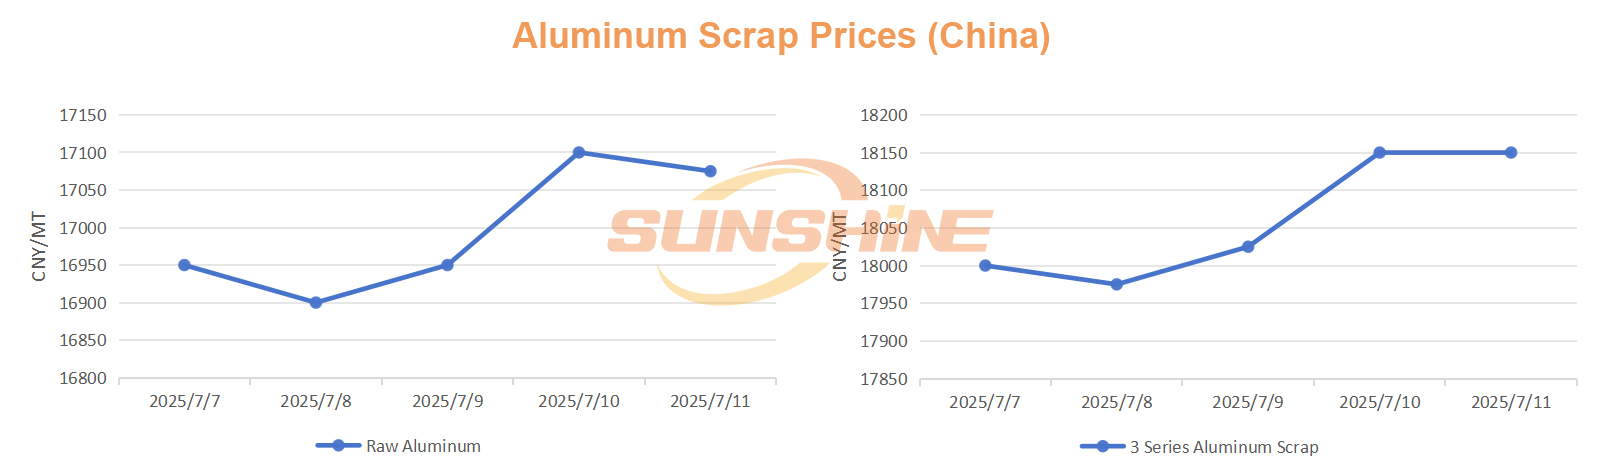
China – Scrap Aluminum Prices
During the week of July 7–11, 2025, scrap aluminum prices in China generally trended upward. Most categories showed stable growth, with weekly increases ranging from 0.60% to 0.83%. Compared to the previous week (reference date: July 4), prices rose slightly by 0% to 0.15%.
1 Series Aluminum Scrap had the largest increase, from 18,125 CNY/MT to 18,275 CNY/MT, up 150 CNY/MT or 0.83%.
Compared to the previous week, Raw Aluminum rose the most, followed by 3 Series Aluminum Scrap, which increased from 18,000 CNY/MT to 18,150 CNY/MT, an increase of 150 CNY/MT or 0.83%.
The chart below shows the price trends of Raw Aluminum and 3 Series Aluminum Scrap for the week.
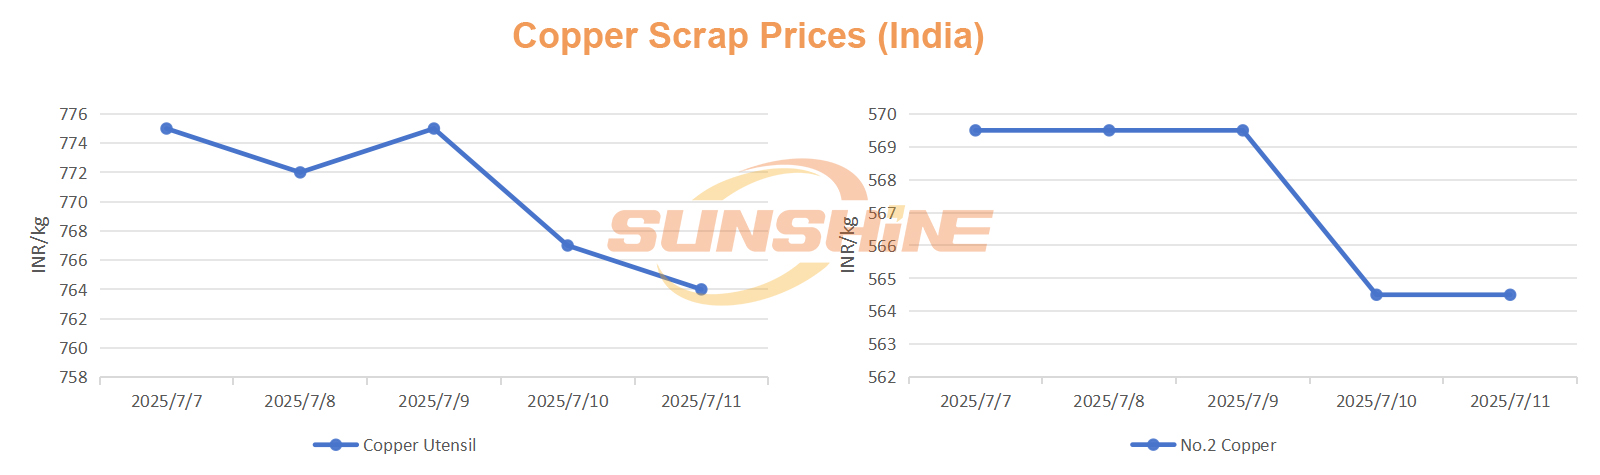
India – Scrap Copper Prices
From July 7 to 11, 2025, India's scrap copper prices experienced minor declines, remaining relatively stable. Overall weekly decreases ranged from 0% to 0.93%. Compared to the previous week, the decline ranged from 0% to 2.14%.
Copper Utensil had the largest weekly drop, falling from 775 INR/kg (July 7) to 764 INR/kg (July 11), a decrease of 11 INR/kg or 1.42%.
Compared to the previous week(reference date: July 4), No.2 Copper showed the largest drop, from 569.50 INR/kg to 564.50 INR/kg, down 5 INR/kg or 0.88%.
The chart below illustrates the weekly price trends of Copper Utensil and No.2 Copper.
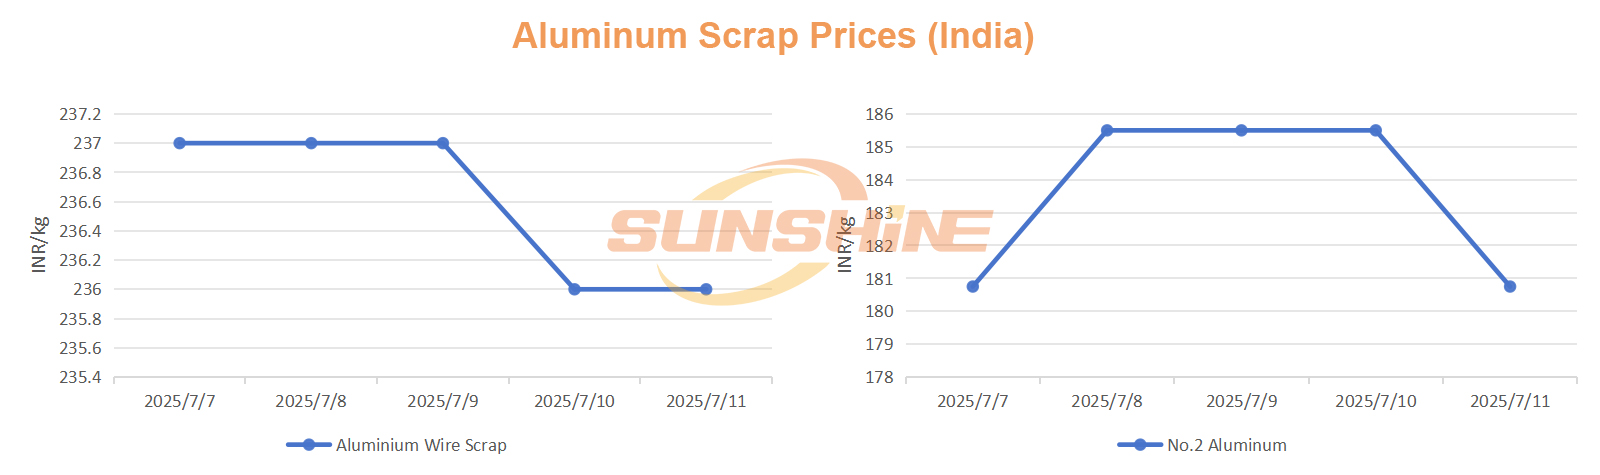
India – Scrap Aluminum Prices
During the same period, scrap aluminum prices in India showed slight declines, with variation among different categories. Weekly declines ranged from 0% to 0.42%. Compared to the previous week(reference date: July 4), a similar downward trend was observed.
Aluminium Wire Scrap fell the most, from 237 INR/kg to 236 INR/kg, a decrease of 1 INR/kg or 0.42%.
Compared to the previous week, No.2 Aluminum showed a slight increase, rising from 180.50 INR/kg to 180.75 INR/kg, an increase of 0.25 INR/kg or 0.14%.
The chart below presents the price trends of Aluminium Wire Scrap and No.2 Aluminum for the week.
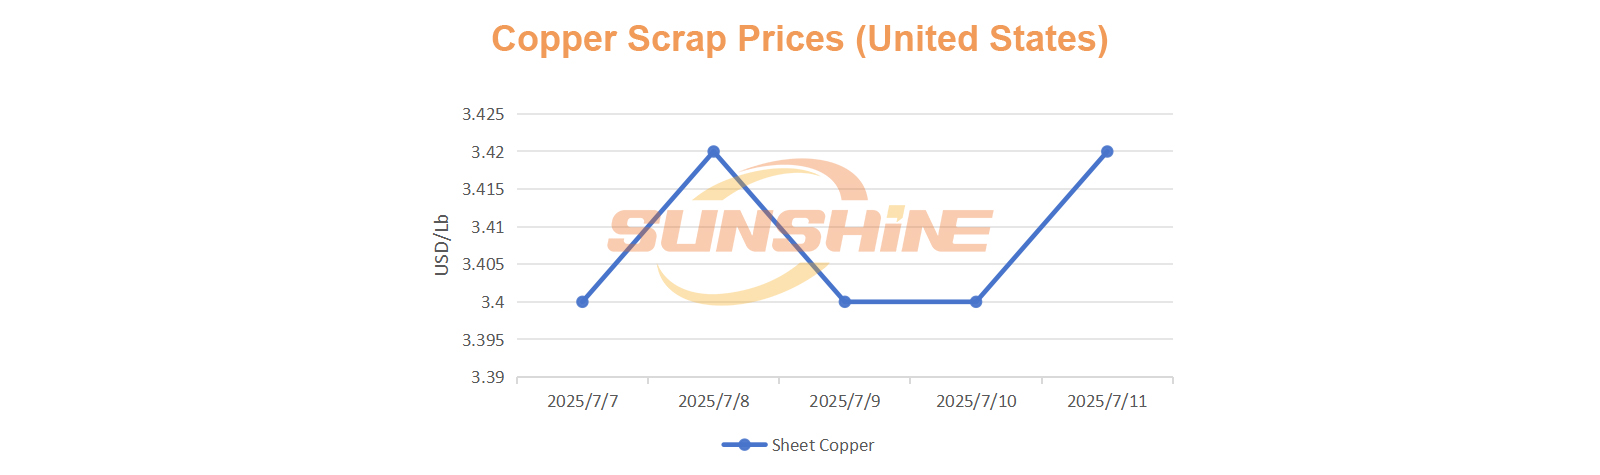
United States – Scrap Copper Prices
During the week of July 7–11, 2025, scrap copper prices in the U.S. rose moderately, with weekly gains ranging from 0.28% to 0.59%. Compared to the previous week(reference date: July 4), prices remained largely stable.
Sheet Copper posted the highest gain, rising from 3.40 USD/Lb to 3.42 USD/Lb, up 0.02 USD/Lb or 0.59%.
The chart below displays the weekly price trend of Sheet Copper.
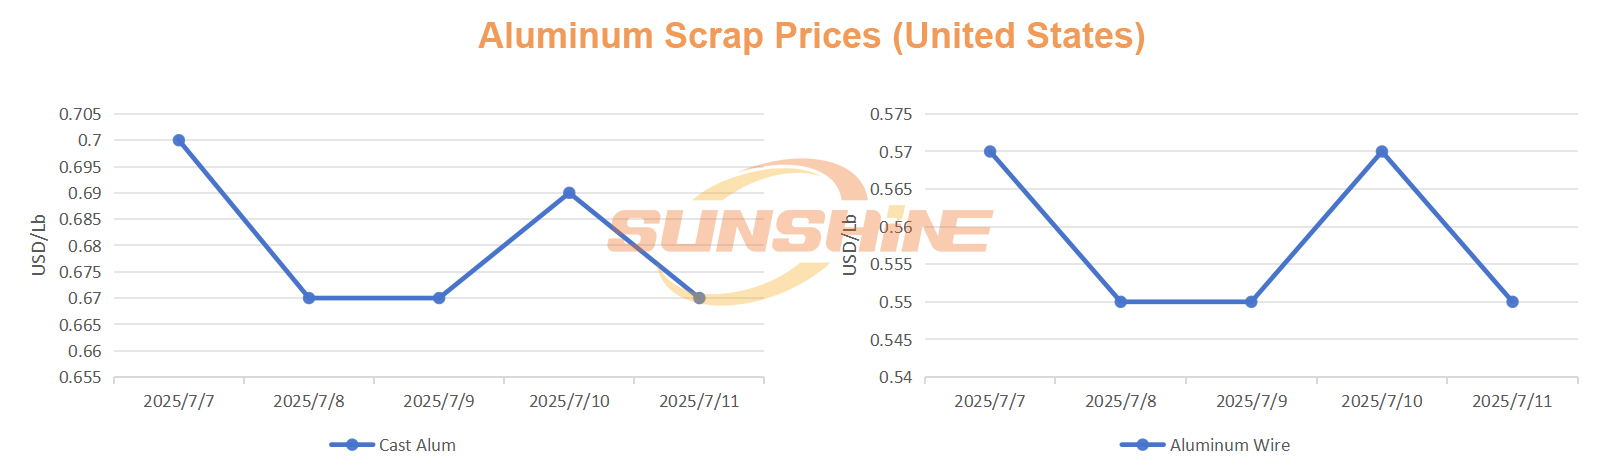
United States – Scrap Aluminum Prices
In the same week, U.S. scrap aluminum prices remained largely stable overall, though some categories saw slight declines.
Cast Alum experienced the largest drop, falling from 0.70 USD/Lb to 0.67 USD/Lb, a decrease of 0.03 USD/Lb or 4.29%. This was followed by Aluminum Wire, which fell from 0.57 USD/Lb to 0.55 USD/Lb, down 0.02 USD/Lb or 3.51%.
The chart below shows the weekly price trends of Cast Aluminum and Aluminum Wire.