Copper Prices Gained! SUNSHINE Weekly Scrap Prices Tracker: June 30-July 4, 2025
This week (June 30 to July 4, 2025), scrap metal prices exhibited some fluctuations across different markets. Based on the price data from SUNSHINE for scrap metals in China, India and United States, the following is a report on the prices of Copper Scrap and Aluminum Scrap in the three countries.
China – Scrap Copper Prices
During the week of June 30 to July 4, 2025, scrap copper prices in China showed a consistent upward trend. Prices remained flat for the first two days and then rose steadily over the following two days, with weekly increases ranging from 0.78% to 1.11%. Compared to the previous week (reference date: June 27), gains were slightly smaller, ranging from 0.68% to 0.97%.
Copper (Cu≈98%) recorded the largest gain, rising from 72,300 CNY/MT (June 30) to 73,100 CNY/MT (July 4), an increase of 800 CNY/MT or 1.11%.
Compared to the previous week, Copper (Cu≈98%) also had the largest gain, followed by Bright Copper Wire, which increased from 73,400 CNY/MT (June 27) to 74,100 CNY/MT (July 4), up 700 CNY/MT or 0.95%.
The following chart illustrates the weekly price trends for Copper (Cu≈98%) and Bright Copper Wire: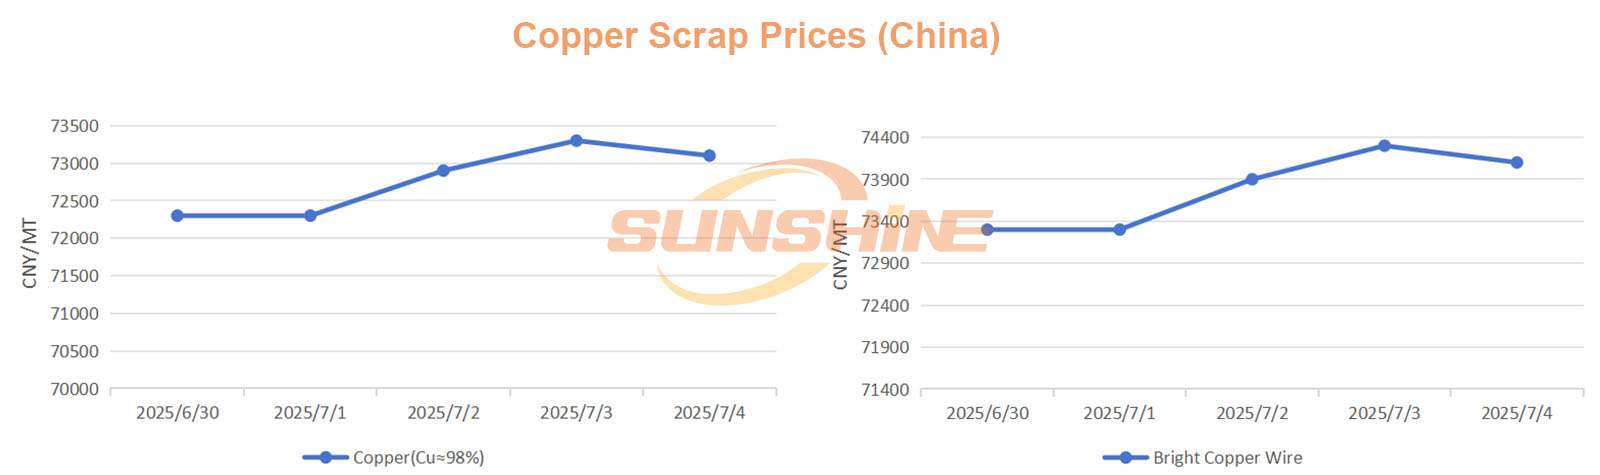
China – Scrap Aluminum Prices
During the week of June 30 to July 4, 2025, scrap aluminum prices in China showed minimal fluctuations. Most categories posted small gains from July 2 to July 3 and then slightly retreated to early-week levels by July 4. Only Packing Cans recorded a slight overall decline. Compared to the previous week (reference date: June 27), most categories saw modest gains of 0.28% to 0.88%, while Iron Free Mechanical Aluminum and Raw Aluminum recorded small declines of 0.57% and 0.58%, respectively.
Packing Cans posted a decline from 15,850 CNY/MT (June 30) to 15,750 CNY/MT (July 4), down 100 CNY/MT or 0.63%.
Compared to the previous week, Used Steam Turbine had the largest gain, increasing from 17,125 CNY/MT (June 27) to 17,275 CNY/MT (July 4), up 150 CNY/MT or 0.88%.
The following chart illustrates the weekly price trends for Packing Cans and Used Steam Turbine: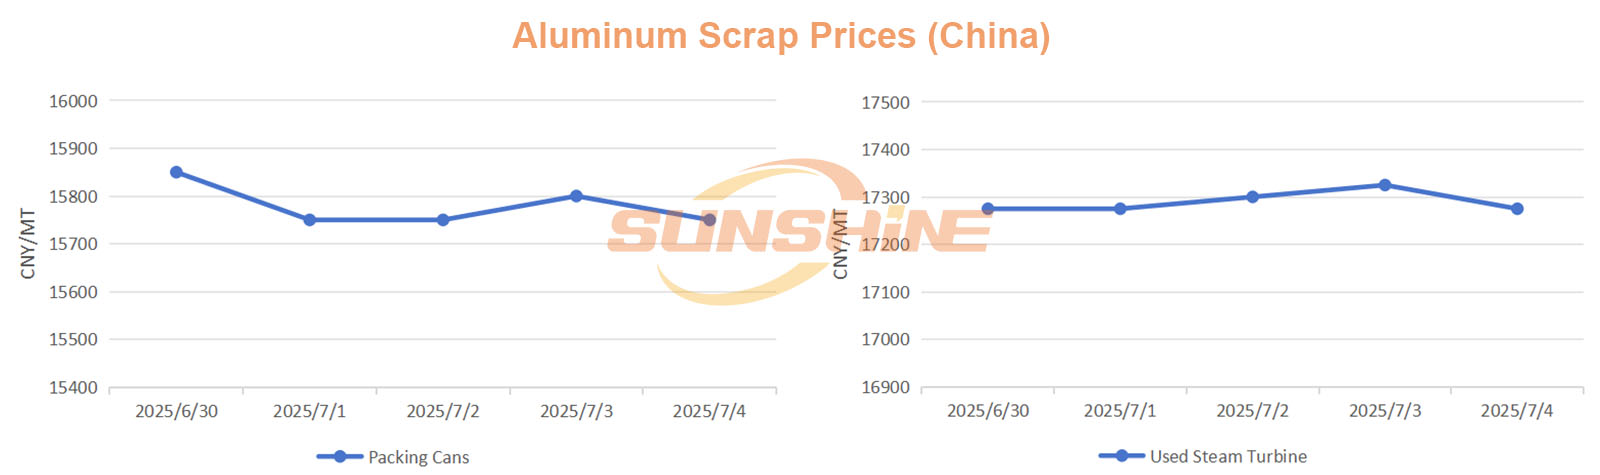
India – Scrap Copper Prices
During the week of June 30 to July 4, 2025, scrap copper prices in India showed a slight upward trend with minimal fluctuations. Weekly gains ranged from 0.24% to 1.60%. Compared to the previous week (reference date: June 27), increases were higher, ranging from 0.49% to 1.65%.
No.2 Copper posted the largest gain, rising from 567.75 INR/kg (June 30) to 576.85 INR/kg (July 4), up 9.10 INR/kg or 1.60%.
Compared to the previous week, No.2 Copper also had the largest increase, followed by No.1 Copper, which rose from 696.50 INR/kg (June 27) to 705.85 INR/kg (July 4), up 9.35 INR/kg or 1.34%.
The following chart illustrates the weekly price trends for No.2 Copper and No.1 Copper: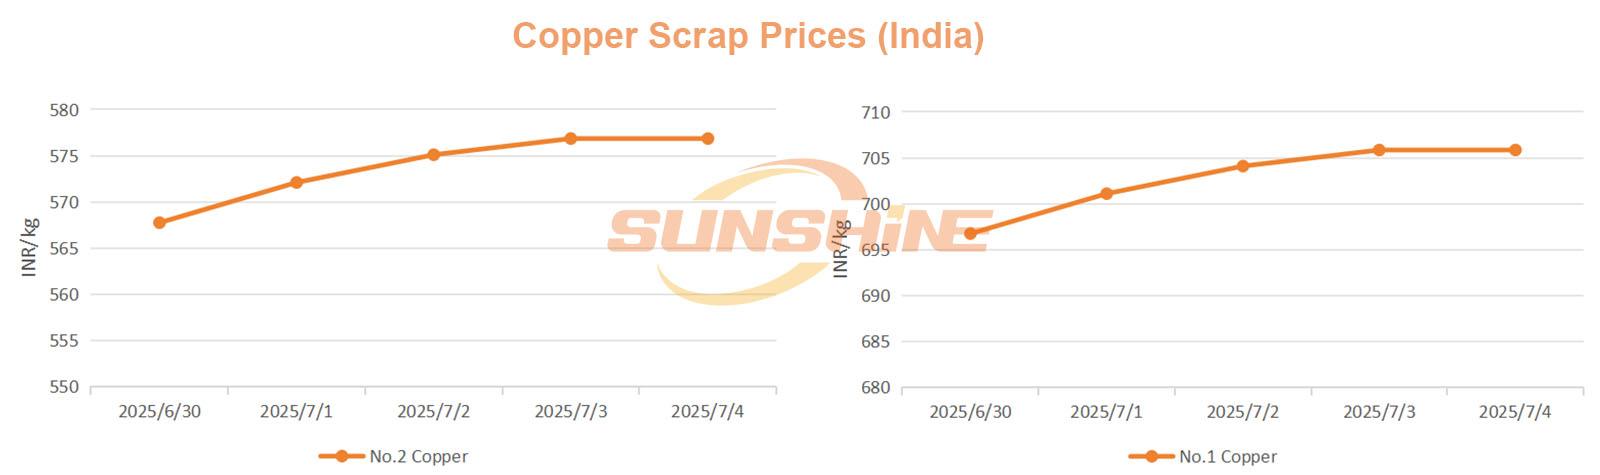
India – Scrap Aluminum Prices
Scrap aluminum prices in India were mixed this week. Most categories recorded gains ranging from 0.49% to 4.03%, while No.2 Aluminum saw a slight decline of 0.14%. Compared to the previous week (reference date: June 27), No.2 Aluminum and Aluminium Accessories Scrap remained unchanged, while other categories posted increases.
No.1 Aluminum posted a notable gain, increasing from 173.75 INR/kg (June 30) to 180.75 INR/kg (July 4), up 7 INR/kg or 4.03%.
Compared to the previous week, No.1 Aluminum had the largest increase, followed by Aluminium Wire Scrap, which rose from 235 INR/kg (June 27) to 237 INR/kg (July 4), up 2 INR/kg or 0.85%.
The following chart illustrates the weekly price trends for No.1 Aluminum and Aluminium Wire Scrap: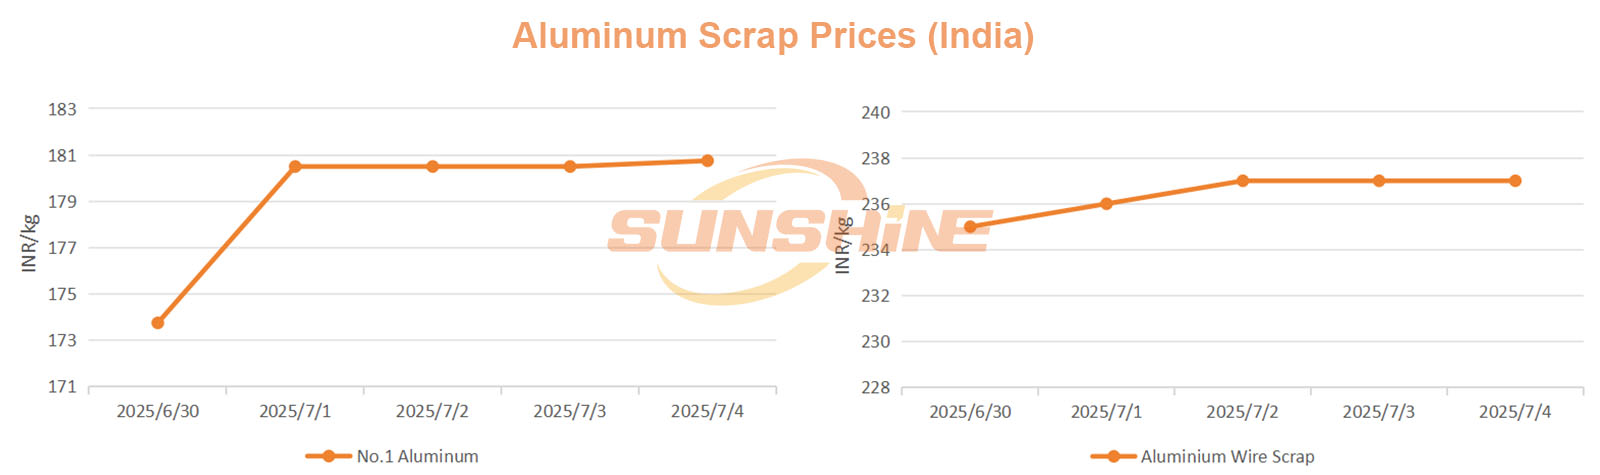
United States – Scrap Copper Prices
During the week of June 30 to July 4, 2025, scrap copper prices in the US showed strong upward momentum. A notable surge occurred mid-week, with a single-day increase of 7.94% on July 2. Weekly gains ranged from 5.00% to 8.23%. Compared to the previous week (reference date: June 27), increases were even higher, ranging from 5.00% to 8.57%.
Sheet Copper recorded the largest gain, rising from 3.16 USD/Lb (June 30) to 3.42 USD/Lb (July 4), an increase of 0.26 USD/Lb or 8.23%.
Compared to the previous week, Sheet Copper also had the largest gain, followed by Copper No.2, which increased from 3.35 USD/Lb (June 27) to 3.61 USD/Lb (July 4), up 0.26 USD/Lb or 7.76%.
The following chart illustrates the weekly price trends for Sheet Copper and Copper No.2: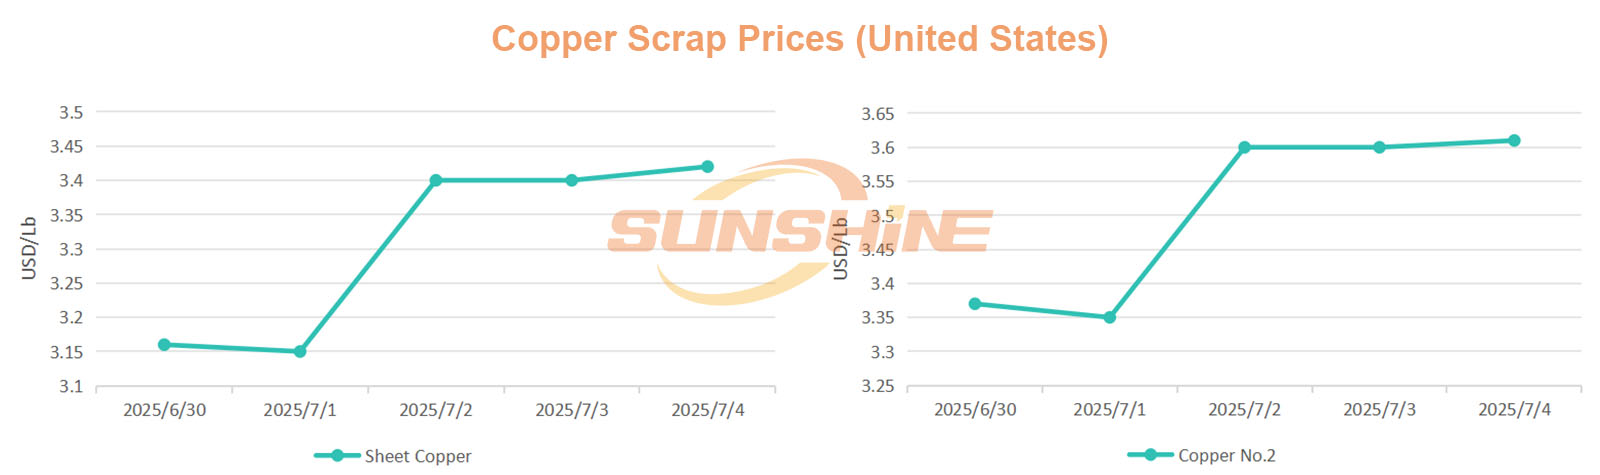
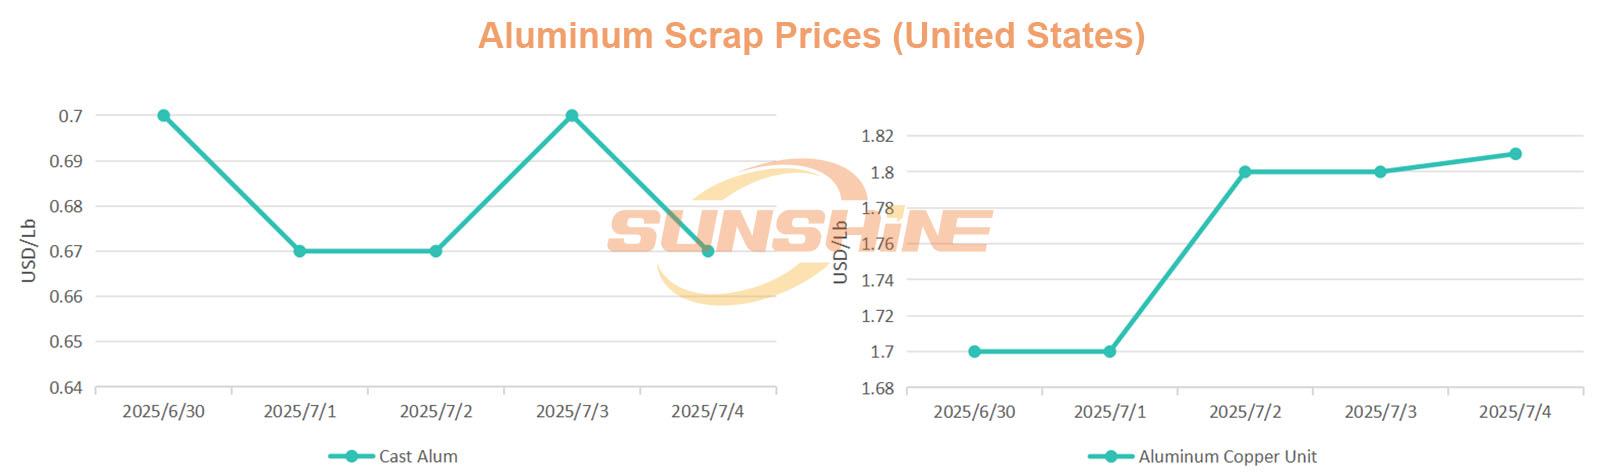
United States – Scrap Aluminum Prices
Scrap aluminum prices in the US were mixed this week. Most categories recorded declines ranging from -1.23% to -4.29%, while Aluminum Copper Unit posted a notable increase of 6.47%. Compared to the previous week (reference date: June 27), all categories remained unchanged except Aluminum Copper Unit.
Cast Alum experienced the largest drop, falling from 0.70 USD/Lb (June 30) to 0.67 USD/Lb (July 4), a decrease of 0.03 USD/Lb or 4.29%.
Compared to the previous week, Aluminum Copper Unit rose from 1.70 USD/Lb (June 27) to 1.81 USD/Lb (July 4), an increase of 0.11 USD/Lb or 6.47%.
The following chart illustrates the weekly price trends for Cast Alum and Aluminum Copper Unit: